World wide weather balloon graphs at your finger tips
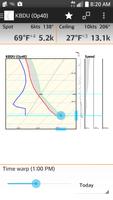
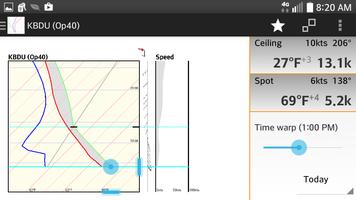
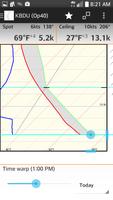
Skew-t Log-P diagrams are commonly used for weather analysis and forecasting. They graph weather balloon data to show the vertical profile of the temperature and dew point through the atmosphere.
See the following Finger Lakes Soaring Club web link for a great article describing how glider pilots use Skew-t graphs to predict weather for a days flight.
http://www.flsc.org/portals/12/PDF/Read_Skew_T.pdf
Features:
Uses data from http://rucsoundings.noaa.gov/
Automatically download the day's weather data
Use the slider to quickly view all hour-by-hour graphs.
Zoom to inspect the graph details
Configurable units and graph lines
Use different weather models
Show forecast graphs for the next few days
Saved favorites to quickly view different locations and/or weather models.
Here mode uses GPS to easily get graphs for your current location.
Load waypoints from files.
Get free Primogems, Mora, Experience, and more with these November 2024 Genshin Impact codes, 5.1 livestream codes, and find out how to redeem active codes.
If you are bored with playing the vanilla version of Metaphor ReFantazio, you can check out these five mods.
Struggling with your submissions for Roblox's The Haunt event in 2024? Check out our guide on using Dress to Impress to create your captures!
Our walkthrough for Dragon Age: The Veilguard with some handy tips and tricks, with guides for puzzles, bosses, companions, equipment, romance, and more!
Which faction should you pick in Dragon Age: The Veilguard?
Looking for some bonus resources in Sea of Conquest: Pirate War? We’ve got you covered with these codes for the latest seafaring freebies.